Illinois Solar Industry Data
2025
Solar Energy Industries Association Data - see most recent data and download the fact sheet by clicking here!
Illinois numbers as of Q1 2025:
Solar Installed (MW): 6,187
National Ranking: 10th
Enough Solar Installed to Power: 961,041 homes
Percentage of State's Electricity from Solar: 2.87%
Solar Jobs: 5,975
Solar Companies in State: 336 (68 Manufacturers, 98 Installers/Developers, 171 Others)
Total Solar Investment in State: 9.9 billion
Prices have fallen 42% over the last 10 years
Growth Projection and Ranking: 12,061 MW over the next 5 years (ranks 7th)
Number Of Installations: 121,949
Illinois is a growing solar market that has benefited from a strong renewable portfolio standard that requires they generate 25% of their energy from renewable sources by 2025. The amount of solar capacity installed in Illinois is expected to grow by more than 1,700% over the next five years.

IREC Solar Jobs Census
Current and past reports from the Solar Jobs Census can be found here.
Illinois Power Agency has developed an interactive map to track the growth of solar energy in Illinois!

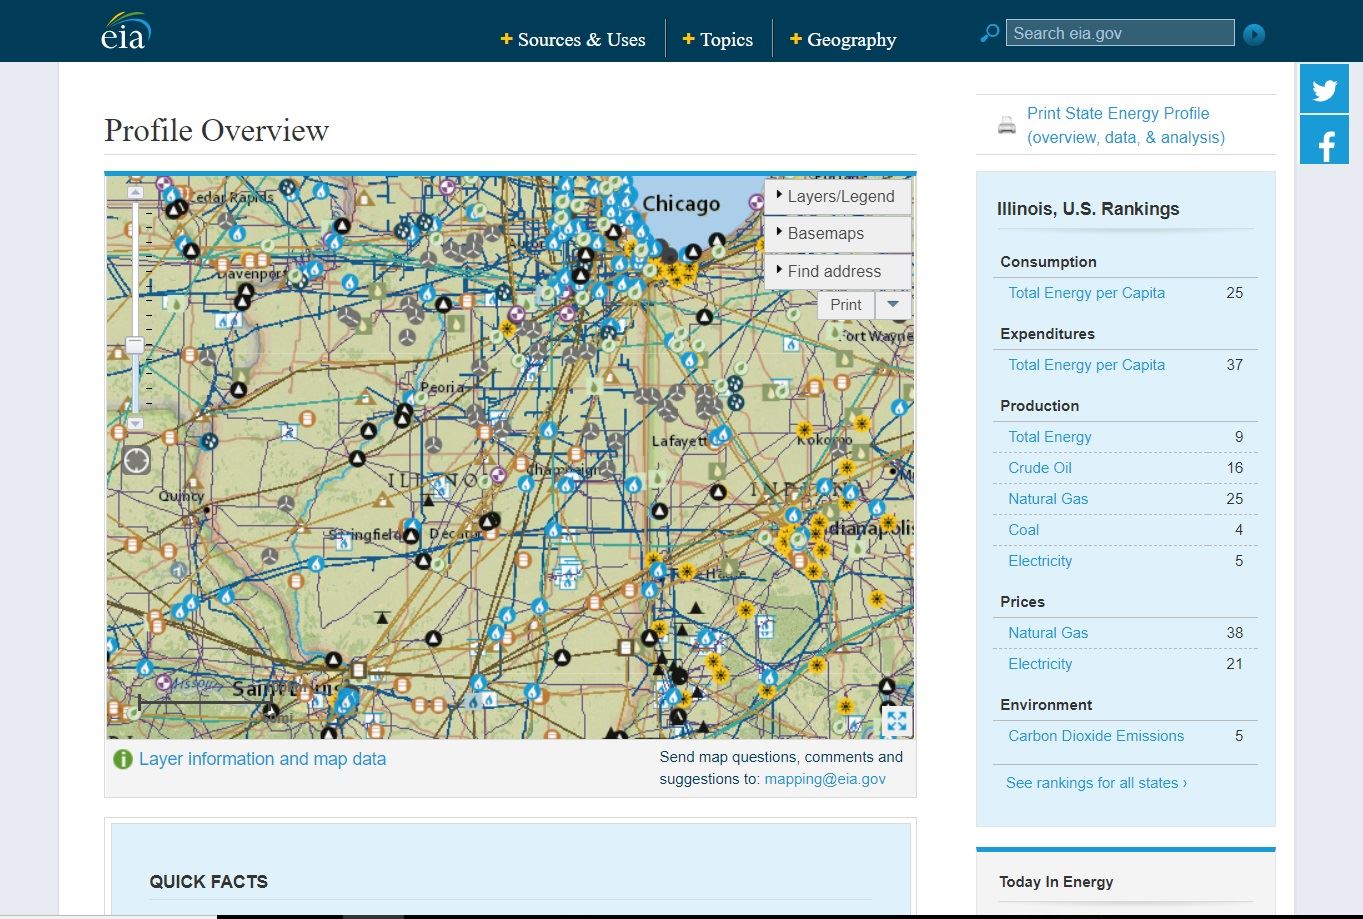
Website with statistics, maps, and technical data about energy. Shows where IL energy is derived, locations and names of power plants, and much more.
BUSINESS RESOURCESPUBLIC EDUCATION | OPPORTUNITIESABOUT US - EducationAbout Us - Energy & Storage |
CONNECT | SEARCH |
Illinois Solar Energy Association 440 W Colfax, #1578 Palatine, IL 60067 | contactisea@illinoissolar.org
Copyright © 2009 - 2018 Illinois Solar Energy Association